Designing an event or membership survey around OKRs (Objectives and Key Results) is a structured approach that leads to more meaningful data collection and better-informed decision-making.
Many associations know they want the guidance that survey data can provide. OKRs are a solution that establishes a purpose-driven pathway. Survey objectives are identified, and the key results allow for continuous improvement and alignment with association goals.
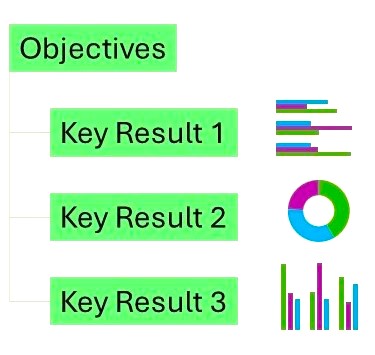
An excellent source to learn about OKRs is Whatmatters.com. According to whatmatters, OKRs are often written with an Objective followed by 3 to 5 supporting Key Results below it. Ideally the objectives are time sensitive, e.g., objectives measured for success or failure in the next quarter. An example for a membership survey may look like this:
Objective: “Increase understanding of member satisfaction to improve membership retention by 10% over the next year.”
Key Results:
- Achieve a 35% response rate from surveyed members.
- Identify the top three factors contributing to member satisfaction.
- Develop actionable insights to address areas of dissatisfaction identified by at least 40% of respondents.
Example Membership Survey Questions
Now that the association’s objective is known and the necessary results are identified, survey questions have focus. The event or membership survey questions should align with the objectives and key results.
Survey questions to find the top three factors contributing to member satisfaction and actional insights to address member dissatisfaction may include the following:
Membership Survey Question: “On a scale of 1 to 10, how satisfied are you with your current membership?”
Membership Survey Question: “Please select the top three benefits you value most from your membership,
Answer option examples, networking opportunities, educational resources, exclusive member events, etc.
Membership Survey Question: “What improvements would you like to see in our membership services?”
Using Survey Results
Moving from a research tactic to executing on the survey findings is achievable with OKRs. The OKR provides the objective, and associations or event managers can measure their key results progress over time. It’s possible that as associations or event producers implement findings they will make adjustments to their plans until they find the optimal approach. Reviewing methods is common, and everyone working toward the same objective makes it clear what, if anything, needs to be changed to reach the objective.
In time, the survey may be put back in the field, annually or more often if it’s appropriate. Insights gained from tracking key results may be used to edit and improve the questionnaire. The survey approach should be flexible to allow for adjustments in each iteration.
OKRs are a notable tactic to improve event or membership survey design. They offer an easy-to-use framework of defined goals and a means to measure success. By using OKRs, associations or event managers have a tool that keeps their surveys focused, and aligned with broader organizational goals.